INDUSRTY ONE CREDIT COURSE ON DATA VISUALIZATION USING POWERBI , KPR Institute Engineering and Technology, Autonomous Engineering Institution, Coimbatore, India

All
UG Courses

Offline (With in the campus)
INDUSRTY ONE CREDIT COURSE ON DATA VISUALIZATION USING POWERBI
One Credit Course (OCC) Dept. Level
DATE
Apr 25, 2024 to Apr 26, 2024
TIME
09:00 AM to 04:00 PM
LOCATION
NMS Lab
DEPARTMENT
Artificial Intelligenceand Machine Learning
TOTAL PARTICIPATES
41
Outcome

The Students gained a deeper understanding of the Power BI platform, its features, and functionalities. Also they learned how to navigate the interface, import data from various sources, create visualizations, and build interactive dashboards and reports. Through hands-on exercises and demonstrations, students developed practical skills in data visualization using Power BI. They learned how to transform raw data into meaningful insights through effective visualizations such as charts, graphs, maps, and tables.

Summary

The session helped the students to deepened their understanding, developed practical skills, and felt empowered to apply their knowledge in real-world scenarios. The aim of this indusrty one credit course is to equip students with the knowledge and skills required to create compelling visualizations and interactive dashboards using the Power BI platform. The course focused on practical applications and hands-on exercises to enhance participants' proficiency in data visualization techniques. The students practiced importing data, creating visualizations, and building interactive dashboards under the guidance of industry experts. The Indusrty one credit course includes real-world examples and case studies demonstrating how Power BI can be used to analyze and visualize data in different industries and domains. Students gained insights into practical applications of Power BI in areas such as business intelligence, finance, marketing, and healthcare. Students learned about best practices for data visualization, including principles of design, color theory. They applied these principles to create visually appealing and informative dashboards and reports that effectively communicate insights to stakeholders. The students were able to learn how to navigate the interface, import data from various sources, create visualizations, and build interactive dashboards and reports.


***END***


Still wondering where to begin?
Apply Now

21st Century Engineering College in Coimbatore

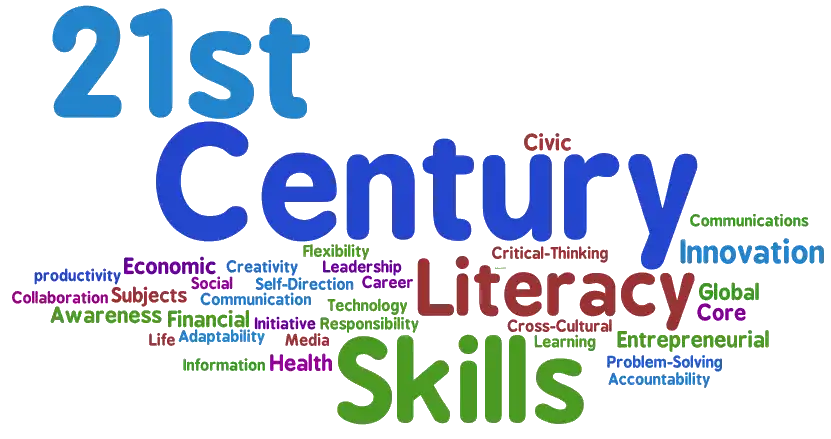
World is transforming everyday. In the rapidly evolving engineering landscape, we have an Increased responsibility to transform the engineering education from traditional curriculum to meet the 21st century skills like Creativity, Critical Thinking, Collaboration and Communication. Through our unique and strategic approach we enable our students to learn beyond and prepare them for life long success.
21st Century Engineering College