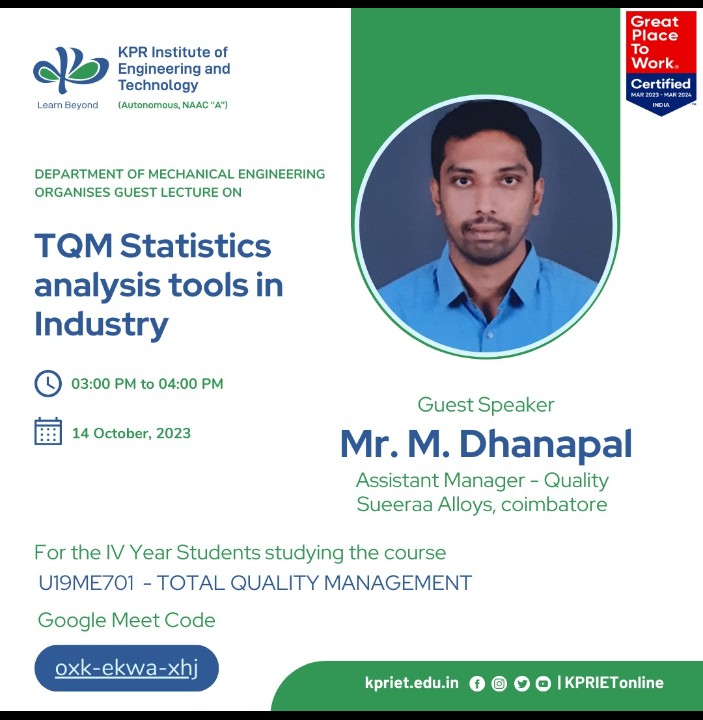
TQM Statistics Analysis Tool in Industry Help the students to know the graphical data of the product which is measured in Quality.
CO3- Tools used in TQM QC tools for Process control.
Guest Speaker: Mr. M. Dhanapal,
Assistant Manager – Quality Sueeraa Alloys,
Has explain the tools used in Industry with current real time example.
Tools and Techniques:
1. Check sheet:
· Data Collection.
· To present the information in a graphical format.
· Data is read by observing the location and number of marks on the sheet.
· Data is recorded by making marks.
2. Pareto chart:
· Used to find the level of the problem and sort it out.
· E.g., Processing credit card applications.
3. Flow chart:
· Process flow chart from the initial stage.
· Example Foundry Process flow (Raw material – Product).
4. Fishbone diagram:
· To find the cause of why the material failed and sort it out.
· E.g., Delayed computer chip release.
5. Histogram:
· It is a graphical representation of the data.
· It enables us to see data which are difficult to see in tables.
· E.g., Overall supplier work.
6. Scatter Diagram:
· It is a line graph without a line.
· Used to predict the area of relationships between two variables.
7. Control chart:
· It is a method of statistical process control
· It is used in production control
· Upper and lower control and tolerance limits are calculated for a process and sample measures are regularly plotted about the center line between the two limit sets.
· The plotted line corresponds to the stability or trend of the process.
· E.g., Organization responsibility and authority
21st Century Engineering College in Coimbatore
World is transforming everyday. In the rapidly evolving engineering landscape, we have an Increased responsibility to transform the engineering education from traditional curriculum to meet the 21st century skills like Creativity, Critical Thinking, Collaboration and Communication. Through our unique and strategic approach we enable our students to learn beyond and prepare them for life long success.