
Gained hands-on experience in importing and managing datasets in Tableau
Understood how Tableau organizes and connects data using logical and physical layers
Learned how to apply different join types to combine multiple data sources effectively
Built and customized sample visualizations to uncover insights from data
21st Century Engineering College in Coimbatore
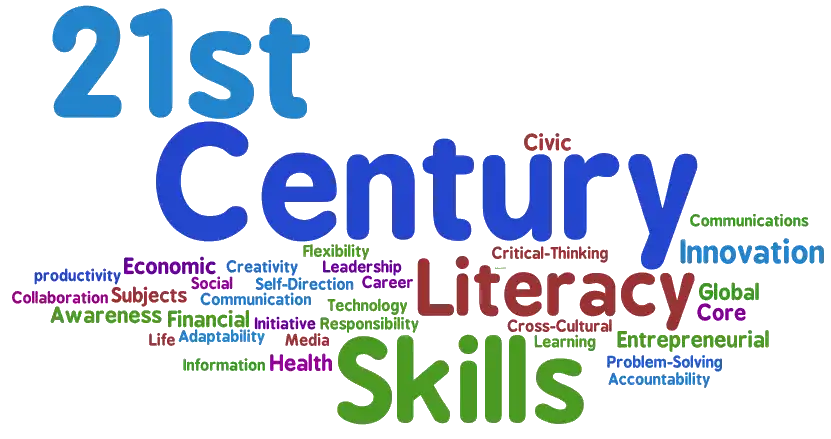
World is transforming everyday. In the rapidly evolving engineering landscape, we have an Increased responsibility to transform the engineering education from traditional curriculum to meet the 21st century skills like Creativity, Critical Thinking, Collaboration and Communication. Through our unique and strategic approach we enable our students to learn beyond and prepare them for life long success.
